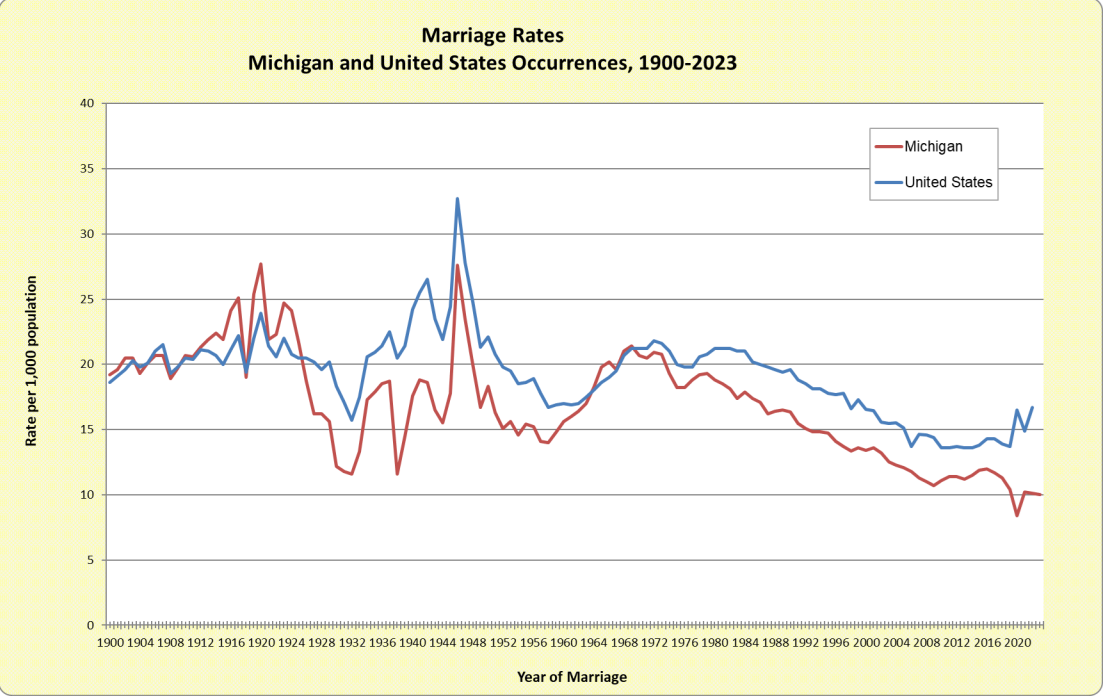
| Note: Rates are
the number of persons married per 1,000 population. Beginning with 1978, marriage data for the U.S. include non-licensed marriages registered in California. If non-licensed marriages were included in the 1977 total, the marriage rate would increase from 19.8 to 20.1. 1991-1999 U.S. data are provisional. (See Federal Register:December 15, 1995 (Vol 60, No. 241); "Change in Marriage and Divorce Data Available From the National Center for Health Statistics" for details on permanent "provisional" status of US marriage statistics.) U.S. marriages from 2000-2007 were estimated using "Table 1300. Marriage and Divorce Rates by Country", U.S. Bureau of Census. Starting in 2008, the number and rates of U.S. marriages were estimated using the U.S. Census Bureau American Community Survey figures. The estimates contain error not indicated in the table. |
| Source: 1900-2023 Michigan Occurrence Marriage
Files,
Division for Vital Records & Health Statistics, Michigan Department of Health & Human Services;
Population Estimates by Age and Race (latest update 7/2025),
U.S Census Bureau.
; National Vital Statistics Report, National Center for Health Statistics and U.S. Bureau of Census. |