Sexually Transmitted Infection Statistics
Bureau of HIV & STI Programs
Michigan Department of Health & Human Services
The Sexually Transmitted Infections (STIs) statistics website reports statistics for three types of infections: chlamydia, gonorrhea, and syphilis. Syphilis is grouped by all syphilis, or as primary and secondary syphilis (P&S Syphilis). P&S Syphilis reports represent initial stages of syphilis, when transmission is most likely to occur. Information for these infections is presently available for the years 1997 through 2024. This information is divided into trend tables and yearly tables by gender, age, counties and health districts.
Overview: Chlamydia is the most commonly reported STI, at a rate of 382.5 per 100,000 population for 2024. During 2019-2023, chlamydia infections were reported on average at a rate of 453.4 per 100,000 population. Gonorrhea was the second most common infection, and was reported at a rate 134.4 in 2024. Primary and secondary infections due to syphilis occurred at 6.8 per 100,000 population. (See Number and Rate tables.)
Gender Disparity: Most STIs exhibit reporting disparities by gender. For example, on average, between 2020-2024, for every 1 male there were 2 females who were diagnosed with chlamydia. Between 2020-2024, for every 1 male there was 1 female who was diagnosed with gonorrhea; but for P & S syphilis, 10 males were reported, for every 3 females. (See Number of Cases, Rates and Percent Distribution tables.)
Trends: The accuracy of STI trends are influenced by two main factors: the proportion of infected people who are tested, and how completely those tests are reported to the health department. These factors have been relatively consistent for syphilis and gonorrhea reporting over the past dozen years, though with some modest improvement in completeness of reporting. However, reporting of chlamydia was first implemented in the 1990s and testing for this infection has increased dramatically. As noted in the Data Quality Considerations below, funding for testing has changed. Therefore, most of the increase in chlamydia reports prior to 2004 was due to improved testing and reporting.
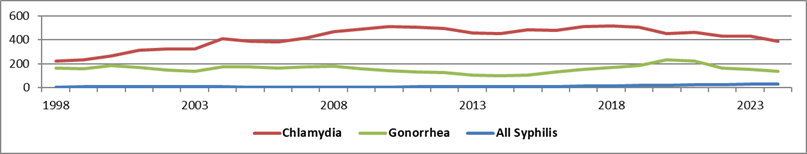
Between 2004-2007, chlamydia rates were stable and without a clear statistical trend. The 2004-2008 range was 380-468 per 100,000 population. Chlamydia cases subsequently occurred at a rate (per 100,00) of 510.6 in 2010 and 506.9 in 2011. The 2010-2011 rates are close to the 2019 rate of 504.4. The 2024 rate of 382.5 was the lowest rate since 2006.
After a long period of stability, with gonorrhea rates in the range of 140 to 180 between 1998-2008, the rate of gonorrhea declined year after year to a historic low of 97.5 per 100,000 in 2014. This low represents a 42 percent decline from the 1998-2008 average. However, between 2014 through 2020, gonorrhea rates rose, peaking at a 2020 rate of 232.5 cases per 100,000. After 2020, the rates decline to a much lower rate of 134.4 cases per 100,000 in 2024.
The incidence of syphilis is much less frequent than chlamydia and gonorrhea. In 2024, the rate of all syphilis peaked at 28.3 per 100,000. Since about 2005, syphilis rates have risen both at the state-level and nationally. Nevertheless, Michigan syphilis rates are historically lower than the national rates: in 2024, the Michigan total syphilis rate was 28.3 and the national rate was 55.9 per 100,000 population. For national syphilis rates and other STI statistics, see the CDC Sexually Transmitted Disease Surveillance Report, 2024.
The trends of rates are charted below; the data is listed in Rate of Chlamydia, Gonorrhea and Syphilis Cases by Sex 2001-2024.
Data Quality Considerations
The completeness of the data presented in these tables is affected by two factors that relate to data accuracy and comparability. It is essential that these factors be considered in using the information particularly when comparing frequencies over time or between geographic areas. These factors are:
The patient must request medical services: The information is obtained from health care facilities providing testing to individuals with sexually transmitted infections. Therefore, it is complete only in so far as individuals have sought testing and records of such testing have been reported to the Michigan Department of Health and Human Services. It is likely that the number of cases reported under represents the incidence of sexually transmitted infections in the population. For chlamydia and gonorrhea, this under representation may be substantial.
Inconsistent testing: It is important to note that there is no state requirement that individuals requesting services at family planning, WIC, MIC and other state sponsored outpatient clinics be tested for chlamydia. Although the state does provide testing support in some clinics, testing for chlamydia may be an additional expense for many service providers. Therefore, some clinics in many counties may not routinely test clients for chlamydia. In addition, local municipalities may apply funds for such testing at their own discretion. This may lead to increased numbers of chlamydia cases being reported as greater funds are released for testing. Counties and local health departments where greater funds are made available for testing may show greater rates of chlamydia cases simply because they have been able to test more individuals.
Historically, race or Hispanic ethnicity data is considered over 90% complete for syphilis cases. Though collection of race information has proven more difficult for gonorrhea and chlamydia cases, collection of the data has improved over the last few years. Currently, the race data is about 75% complete for these infections. Race and ethnicity data are expected to improve further over the next few years. Incomplete race statistics are provided in the interest of timely reporting.
For additional information on sexually transmitted infections, please visit: Sexually Transmitted Infections at Michigan.gov
(https://www.michigan.gov/HIVSTI).
Last Updated: 10/03/2025